
Monitor Your Server with Grafana, Prometheus & Node Exporter (Docker)
Whether you're hosting a personal blog, running a small business website, or managing critical infrastructure, knowing the health and performance of your server is essential. Server monitoring helps you catch issues before they become problems, optimize resource usage, and ensure your services stay online.
In this guide, you'll learn how to set up a professional-grade monitoring stack using three powerful open-source tools: Node Exporter (collects metrics), Prometheus (stores and queries data), and Grafana (visualizes everything beautifully). We'll use Docker Compose to make the setup incredibly simple and reproducible.
While you can install these tools manually, Docker offers significant advantages: isolated environments, easy updates, reproducible configs, and simple rollbacks. Plus, this entire setup is free, lightweight, and can run alongside your existing services. Let's dive in!
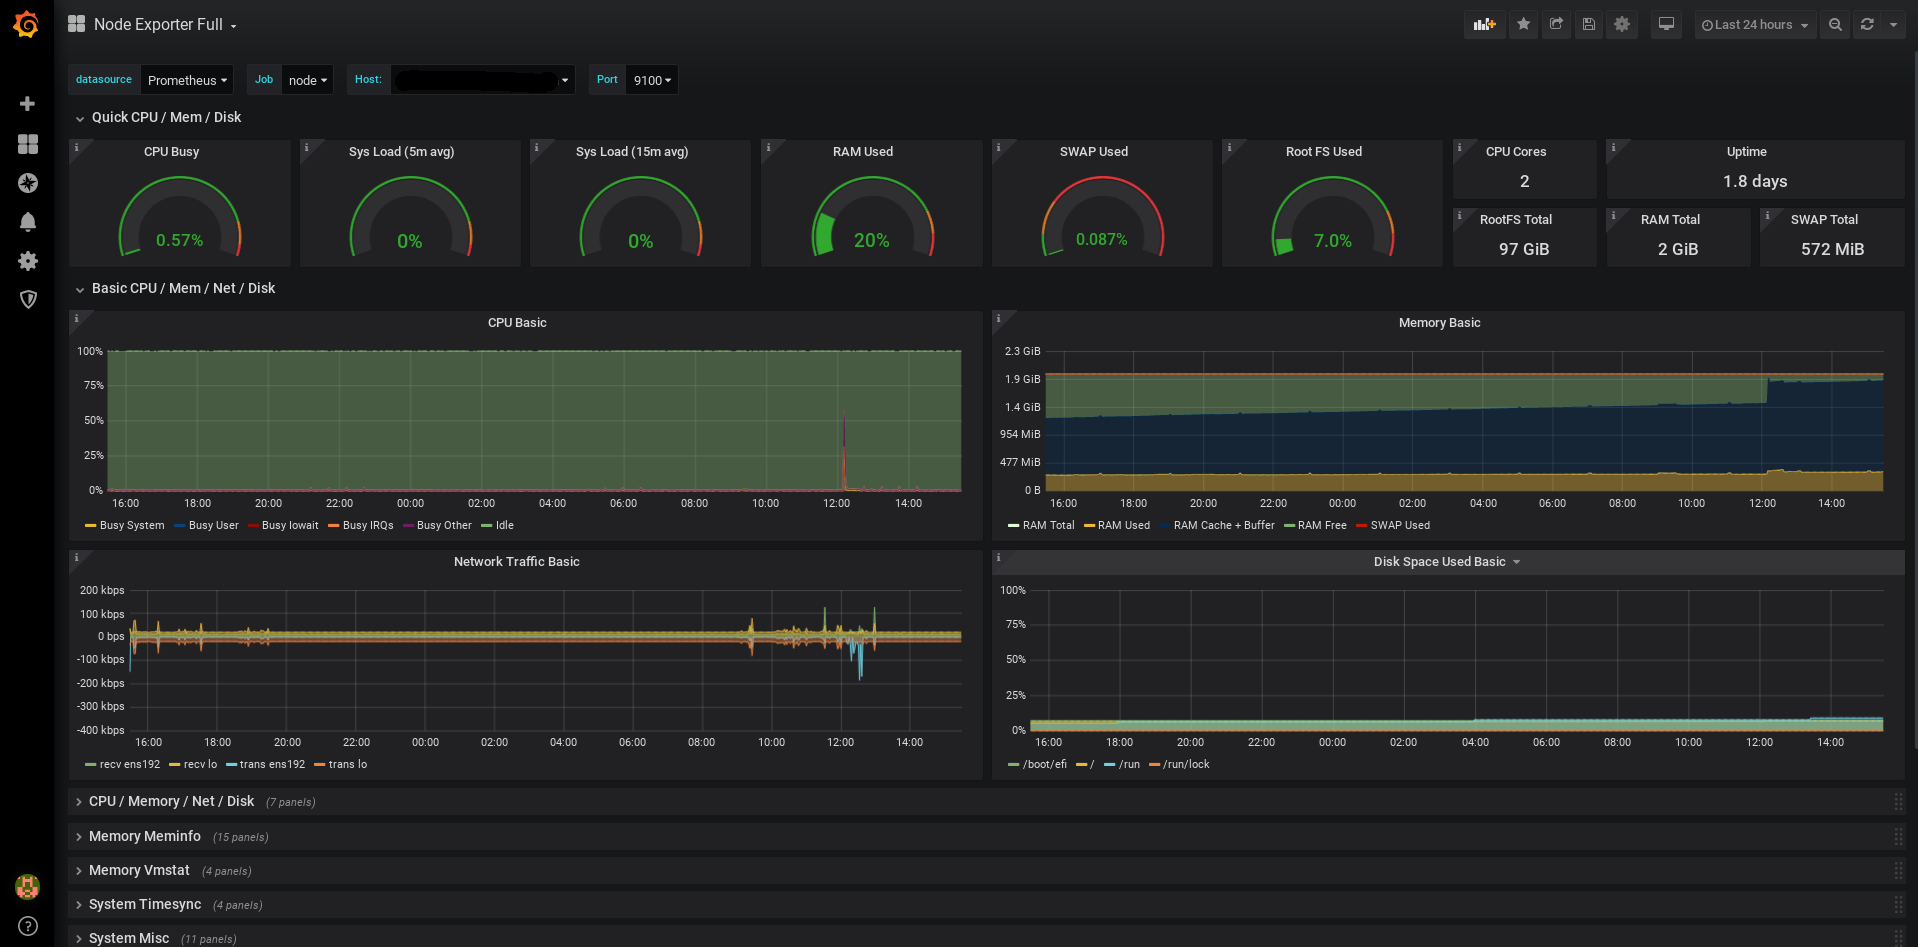
Preview: A complete Node Exporter dashboard showing real-time server metrics
Why Use Docker for Monitoring?
While you can install Prometheus, Grafana, and Node Exporter directly on your system, Docker offers compelling advantages:
Isolation & Clean Environment
Each component runs in its own container, avoiding conflicts with your system packages or other applications.
Easy Updates & Rollbacks
Update to the latest version with 'docker compose pull && docker compose up -d'. If something breaks, roll back by changing one line in your config.
Reproducible Setup
Your entire monitoring stack is defined in one docker-compose.yml file. Copy it to another server, run 'docker compose up', done.
Portable & Consistent
Works identically on Ubuntu, Debian, Fedora, or any Linux distribution. No dependency hell, no package manager differences.
Resource Management
Docker makes it easy to set resource limits, restart policies, and health checks. Plus, you can monitor multiple servers from one Prometheus instance.
The Monitoring Stack
Our monitoring solution consists of three components that work together seamlessly, all containerized with Docker:
Node Exporter
A lightweight agent that runs on your server and collects system metrics like CPU usage, memory consumption, disk I/O, and network traffic. It exposes these metrics in a format Prometheus can understand.
Prometheus
A time-series database that scrapes (collects) metrics from Node Exporter at regular intervals. It stores this data efficiently and provides a powerful query language (PromQL) for analyzing it.
Grafana
A beautiful visualization platform that connects to Prometheus and turns raw metrics into stunning, interactive dashboards. Think of it as the window into your server's soul.
Prerequisites
Before we begin, make sure you have:
- • A Linux server (VPS, dedicated server, or even a Raspberry Pi) - compare VPS options on our homepage
- • SSH access to your server with sudo privileges
- • Docker and Docker Compose already installed on your server
- • Basic familiarity with the command line and Docker concepts
- • At least 1GB of free RAM and 2GB of disk space for volumes
Step-by-Step Installation
1. Create Docker Compose Configuration
Create a directory for your monitoring stack and set up the configuration:
- Create project directory: mkdir -p ~/monitoring && cd ~/monitoring
- Create docker-compose.yml file with the monitoring stack configuration
- Create prometheus.yaml configuration file to define scrape targets
- Set appropriate permissions: chmod 644 docker-compose.yml prometheus.yaml
services:
    prometheus:
        image: docker.io/prom/prometheus:latest
        container_name: prometheus
        command: "--config.file=/etc/prometheus/prometheus.yaml --storage.tsdb.retention.time=30d"
        networks:
          - prometheus
        expose:
          - 9090
        volumes:
          - ./prometheus.yaml:/etc/prometheus/prometheus.yaml:ro
          - prometheus_data:/prometheus
        restart: unless-stopped

    grafana:
        container_name: grafana
        image: grafana/grafana-oss:latest
        networks:
          - prometheus
        ports:
          - "127.0.0.1:3000:3000"
        restart: unless-stopped
        volumes:
          - grafana_storage:/var/lib/grafana
          - grafana_config:/etc/grafana

    node_exporter:
        image: quay.io/prometheus/node-exporter:latest
        container_name: node_exporter
        expose:
          - 9100
        command:
          - '--path.rootfs=/host'
        pid: host
        restart: unless-stopped
        networks:
          - prometheus
        volumes:
          - '/:/host:ro,rslave'

volumes:
    grafana_storage:
    grafana_config:
    prometheus_data:

networks:
prometheus:2. Configure Prometheus
Create the Prometheus configuration file (prometheus.yaml):
- The configuration defines how often to scrape metrics (default: every 15 seconds)
- Add node_exporter as a scrape target pointing to the Docker container
- Optionally configure retention time for data (30 days is a good default)
- You can add multiple targets to monitor several servers from one Prometheus instance
global:
  scrape_interval: 15s

scrape_configs:
  - job_name: 'node'
    static_configs:
      - targets: ['node_exporter:9100']
3. Start the Stack
With everything configured, let's bring up the monitoring stack:
- Start all services: docker compose up -d (the -d flag runs containers in the background)
- Check status: docker compose ps (all services should show 'running')
- View logs: docker compose logs -f (press Ctrl+C to exit)
- Access Grafana at http://your-server-ip:3000 (default login: admin/admin)
- Access Prometheus at http://your-server-ip:9090 (optional, for advanced users)
Configuring Your First Dashboard
Now that everything is running via Docker, let's set up Grafana to display your metrics:
Add Prometheus as a Data Source
In Grafana, go to Configuration → Data Sources → Add data source → Prometheus. Set the URL to http://prometheus:9090 (Docker internal networking) and click 'Save & Test'.
Import a Pre-built Dashboard
Go to Dashboards → Import, enter dashboard ID 1860 (Node Exporter Full), select your Prometheus data source, and click Import. Instantly, you'll see beautiful graphs of your server metrics! Browse the Grafana Dashboard Library at grafana.com/grafana/dashboards for thousands of pre-built dashboards for all kinds of services.
Explore More Possibilities
Grafana is highly customizable and can visualize virtually any type of data - from server metrics to IoT sensors, from application logs to business analytics. The dashboard library offers ready-made solutions for databases, web servers, containers, cloud platforms, and much more. You can also create completely custom dashboards tailored to your specific needs.
Customize Your View
Click the dashboard settings (gear icon) to adjust refresh rates, time ranges, and panel layouts. Remove panels you don't need and add new ones by clicking 'Add panel'.
Set Up Alerts (Optional)
Configure alert rules to notify you when CPU usage is too high, disk space is running low, or services go down. Grafana can send alerts via email, Slack, Discord, and many other channels.
Real-World Use Cases
This Docker-based monitoring setup works for everyone, from hobbyists to professionals:
The Self-Hoster
You're running Nextcloud, Jellyfin, or a home automation server. You want to know if something's eating your RAM or if your disk is filling up.
Deploy the monitoring stack alongside your services with docker-compose. No manual installation, no system-wide packages. If you decide to remove it, just 'docker compose down' and it's gone.
The Developer
You're developing a web application and want to understand its resource consumption before deploying to production.
Run the monitoring stack in development with the same config as production. See real-time impact of your code changes. Export/import dashboards between environments.
Small Business Owner
Your company website is critical for business. You need to know if the server is healthy and when it's time to upgrade.
Get alerts before customers notice problems. Easy backup: just copy your docker-compose.yml and Prometheus data volume. Migrate to a bigger server in minutes.
Professional Sysadmin
You manage multiple servers for clients or your organization. You need centralized monitoring with detailed metrics and alerting.
Deploy identical stacks across all servers. Use Docker's network features to monitor multiple nodes. Version control your entire monitoring infrastructure.
Best Practices & Docker Tips
Secure Your Dashboards
Use Traefik or nginx as a reverse proxy with HTTPS. Don't expose ports directly to the internet. The example binds Grafana to 127.0.0.1 for local access only.
Persist Your Data
The docker-compose.yml uses named volumes for Grafana and Prometheus data. This ensures your dashboards and metrics survive container restarts. Backup these volumes regularly: 'docker run --rm -v monitoring_grafana_storage:/data -v $(pwd):/backup busybox tar czf /backup/grafana-backup.tar.gz /data'
Regular Updates & Security Monitoring
Update your containers monthly: 'docker compose pull && docker compose up -d'. Docker makes this safe - if something breaks, just revert the image tag in your compose file. Follow release notes for Grafana, Prometheus, and Node Exporter. Subscribe to security advisories and CVE notifications for these projects to stay informed about vulnerabilities.
Monitor Multiple Servers
Deploy node_exporter on each server you want to monitor. Update prometheus.yaml to add new scrape targets. One Prometheus instance can monitor dozens of servers.
Next Steps & Advanced Topics
Once you're comfortable with the Docker-based setup, explore these advanced topics:
- • Add more exporters to your docker-compose.yml: MySQL, PostgreSQL, nginx, Redis, or Blackbox exporter for endpoint monitoring
- • Deploy Alertmanager as another container for sophisticated alert routing, grouping, and silencing
- • Use docker-compose profiles to run development vs production configurations with one command
- • Explore PromQL (Prometheus Query Language) for advanced metric queries and custom panels
- • Set up Docker Swarm or Kubernetes for high-availability monitoring across multiple nodes
- • Use Grafana's provisioning feature with Docker volumes to automatically deploy dashboards as code
- • Monitor Docker containers themselves with cAdvisor (Google's container advisor) in your stack
Conclusion
Congratulations! You now have a professional monitoring stack running in Docker containers. The beauty of this setup is that it's completely portable, easy to maintain, and can be deployed to another server in minutes. While it's possible to install these tools manually without Docker, the containerized approach offers significant advantages in terms of isolation, reproducibility, and ease of updates. You can now monitor CPU usage, memory consumption, disk I/O, network traffic, and much more - all from beautiful Grafana dashboards.
Need a reliable server to run your monitoring stack? Check out our VPS comparison to find the perfect server for your needs - with transparent pricing and detailed specifications to help you make an informed decision.